Sampling Module
Sampling functions for generating random points on geometric objects.
|
Generate random samples on a 2D circle with a specified radius and center. |
|
Sample a n_samples number of points from a 3D circle using the rejection sampling method. |
|
Sample a n_samples number of points from a 2D parallelogram. |
|
Sample points from a parallelogram with sides parallel to the x and y axes. |
|
Sample n_samples points from a parallelogram |
|
Sample n_samples points from a parallelepiped |
|
|
|
Generate random samples on a sphere with a specified radius and center. |
|
Sample elements from a numpy array. |
|
Sample points from a point cloud. |
|
Returns a list with number_of_np_arrays numpy arrays of size cardinality_of_np_arrays with random elements from a list or numpy array. |
- sampling.sampling_alligned_parallelogram_2d(n_samples: int, min_x: float, max_x: float, min_y: float, max_y: float, seed: int | None = None) List[Tuple[float, float]][source]
Sample points from a parallelogram with sides parallel to the x and y axes.
- Parameters:
n_samples (int) – The number of samples to generate.
min_x (float) – The minimum x coordinate of the parallelogram.
max_x (float) – The maximum x coordinate of the parallelogram.
min_y (float) – The minimum y coordinate of the parallelogram.
max_y (float) – The maximum y coordinate of the parallelogram.
seed (Optional[int]) – The seed to use for the random number generator.
- Returns:
A list of tuples (x, y) representing the coordinates of the sampled points.
- Return type:
List[Tuple[float, float]]
Note
The samples are uniformly distributed on the parallelogram.
Examples
Sample 100 points from a parallelogram with sides parallel to the x and y axes:
Required imports:
>>> import rsaitehu.sampling as sampling
>>> import rsaitehu.geometry as geometry
>>> import matplotlib.pyplot as plt
Define the limits of the parallelogram and the number of points to sample:
>>> n_samples = 100
>>> min_x = -3
>>> max_x = 2
>>> min_y = -1
>>> max_y = 5
Sample the points:
>>> samples = sampling.sampling_alligned_parallelogram_2d(n_samples=n_samples, min_x=min_x,
>>>                                          max_x=max_x, min_y=min_y, max_y=max_y, seed=42)
>>> # list the first 5 samples
>>> samples[:5]
[(0.19713399228941864, -0.8499354686639984),
(-1.6248534081544037, 0.3392644288929365),
(0.6823560708200622, 3.0601969245374683),
(1.460897838524227, -0.4783670042235031),
(-0.8903909015736478, -0.8212166833715779)]
Plot the samples:
>>> fig, ax = plt.subplots()
>>> graph_limits = geometry.get_limits_of_graph_from_limits_of_object(min_x, max_x, min_y, max_y)
>>> ax.set_xlim(graph_limits[0], graph_limits[1])  # Set x-axis limits
>>> ax.set_ylim(graph_limits[2], graph_limits[3]*1.1)  # Set y-axis limits
>>> ax.scatter(*zip(*samples))
>>> ax.set_aspect('equal')
>>> # create title from n_samples, center, and radius, usign fstring
>>> title = (f'{n_samples} Samples on an axes alligned Parallelogram with bottom left corner '
>>>          f'({min_x}, {min_y}) and top right corner ({max_x}, {max_y})'
>>>     )
>>> ax.set_title(title)
>>> # draw also the parallelogram in red
>>> ax.plot([min_x, max_x], [min_y, min_y], color='r')
>>> ax.plot([min_x, max_x], [max_y, max_y], color='r')
>>> ax.plot([min_x, min_x], [min_y, max_y], color='r')
>>> ax.plot([max_x, max_x], [min_y, max_y], color='r')
>>> ax.set_xlabel('X')
>>> ax.set_ylabel('Y')
>>> # Draw the X and Y axes in dotted lines
>>> ax.axhline(0, linestyle='dotted', color='black')
>>> ax.axvline(0, linestyle='dotted', color='black')
>>> plt.show()

- sampling.sampling_circle_2d(n_samples: int = 1, center: Tuple[float, float] = (0, 0), radius: float = 1, seed: int | None = None)[source]
Generate random samples on a 2D circle with a specified radius and center.
- Parameters:
n_samples (int) – The number of random samples to generate on the circle.
center (Tuple[float, float]) – A tuple (x, y) representing the center of the circle. Default is (0,0).
radius (float) – The radius of the circle. Default is 1.
seed (int) – The seed value for the random number generator. Default is None.
- Returns:
A list of tuples (x, y) representing the coordinates of the sampled points.
- Return type:
List[Tuple[float, float]]
Note
The samples are uniformly distributed on the circle.
Examples
Generate 100 random samples on a circle with center (2,3) and radius 5:
Required imports:
>>> import rsaitehu.sampling as sampling
>>> import rsaitehu.geometry as geometry
>>> import matplotlib.pyplot as plt
Define the limits of the parallelogram and the number of points to sample:
>>> n_samples = 100
>>> center = (2,3)
>>> radius = 5
Generate the samples:
>>> samples = sampling.sampling_circle_2d(n_samples=100, center=center, radius=radius, seed=42)
>>> # list the first 5 samples
>>> samples[:5]
[(3.3942679845788373, -1.7498924477733304),
(-0.24970681630880742, 0.23210738148822774),
(4.364712141640124, 4.766994874229113),
(1.2192181968527043, -1.7020278056192968),
(-0.8136202519639664, 3.0535528810336237)]
Plot the samples:
>>> fig, ax = plt.subplots()
>>> xlim_min = center[0] - radius
>>> xlim_max = center[0] + radius
>>> ylim_min = center[1] - radius
>>> ylim_max = center[1] + radius
>>> graph_limits = geometry.get_limits_of_graph_from_limits_of_object(xlim_min, xlim_max, ylim_min, ylim_max)
>>> ax.set_xlim(graph_limits[0], graph_limits[1])  # Set x-axis limits
>>> ax.set_ylim(graph_limits[2], graph_limits[3]*1.1)  # Set y-axis limits
>>> ax.scatter(*zip(*samples))
>>> ax.set_aspect('equal')
>>> # create title from n_samples, center, and radius, using f-string
>>> title = (f'{n_samples} Samples on a Circle with Center {center} and Radius {radius}')
>>> ax.set_title(title)
>>> # draw also the circle in red
>>> circle = plt.Circle(center, radius, color='r', fill=False)
>>> ax.add_artist(circle)
>>> # draw the X and Y axes in dotted lines
>>> ax.axhline(0, linestyle='dotted', color='black')
>>> ax.axvline(0, linestyle='dotted', color='black')
>>> ax.set_xlabel('X')
>>> ax.set_ylabel('Y')
>>> plt.show()

- sampling.sampling_circle_3d(n_samples, radius: float = 1.0, center: ndarray = array([0, 0, 0]), normal: ndarray = array([0, 0, 1]), seed: int | None = None) List[ndarray][source]
Sample a n_samples number of points from a 3D circle using the rejection sampling method.
- Parameters:
n_samples (int) – The number of samples to generate.
radius (float) – The radius of the circle.
center (np.ndarray) – The center of the circle.
normal (np.ndarray) – The normal vector of the plane on which the circle lies.
- Returns:
A list of tuples (x, y, z) representing the coordinates of the sampled points.
- Return type:
List[Tuple[float, float, float]]
Note
The samples are uniformly distributed on the circle.
- Example:
Sample 100 points from a circle in an arbitrary position and with arbitrary normal vector:
Required imports:
>>> import rsaitehu.sampling as sampling
>>> import rsaitehu.geometry as geom
>>> import rsaitehu.matplot3d as plt3d
>>> import matplotlib.pyplot as plt
>>> import numpy as np
Define the parameters of the circle and the number of points to sample:
>>> n_samples = 100
>>> radius = 5
>>> center = np.array([1, 2, 0])
>>> normal = np.array([1, 1, 0]) / np.linalg.norm(np.array([1, 1, 0]))
Sample the points:
>>> samples = sampling.sampling_circle_3d(n_samples=n_samples, radius=radius, center=center, normal=normal, seed=42)
>>> # list the first 5 samples
>>> samples[:5]
[array([ 4.07208022, -1.07208022, -2.24970682]),
array([-1.56630238,  4.56630238,  1.76699487]),
array([0.05579622, 2.94420378, 0.05355288]),
array([0.13849159, 2.86150841, 1.49884438]),
array([2.62250429, 0.37749571, 0.89265684])]
Plot the 3D circle and the samples:
>>> fig = plt.figure()
>>> ax = fig.add_subplot(111, projection='3d')
>>> plt3d.draw_circumference(center=center, radius=radius, normal=normal, color="blue", alpha=0.2, ax=ax)
>>> xlim_min = np.min([sample[0] for sample in samples])
>>> xlim_max = np.max([sample[0] for sample in samples])
>>> ylim_min = np.min([sample[1] for sample in samples])
>>> ylim_max = np.max([sample[1] for sample in samples])
>>> zlim_min = np.min([sample[2] for sample in samples])
>>> zlim_max = np.max([sample[2] for sample in samples])
>>> graph_limits = geom.get_limits_of_3d_graph_from_limits_of_object(xlim_min, xlim_max, ylim_min, ylim_max, zlim_min, zlim_max)
>>> ax.set_xlim(graph_limits[0], graph_limits[1])  # Set x-axis limits
>>> ax.set_ylim(graph_limits[2], graph_limits[3])  # Set y-axis limits
>>> ax.set_zlim(graph_limits[4], graph_limits[5])  # Set z-axis limits
>>> ax.scatter(*zip(*samples))
>>> # create title from n_samples, center, and radius, using f-string
>>> title = (f'{n_samples} Samples on a Circle with Center {center} and Radius {radius}')
>>> ax.set_title(title)
>>> ax.set_xlabel('X')
>>> ax.set_ylabel('Y')
>>> ax.set_zlabel('Z')
>>> plt.show()

- sampling.sampling_np_array_elements(elements: ndarray, num_samplings: int = 1, replacement: bool = False, len_elements: int | None = None, seed: int | None = None) ndarray[source]
Sample elements from a numpy array.
- Parameters:
elements (np.ndarray) – The array of elements to sample from.
num_samplings (int) – The number of elements to sample. Default is 1.
replacement (bool) – Whether to sample with replacement or not. Default is False.
len_elements (int) – The length of the elements array. Default is None.
seed (int) – The seed value for the random number generator. Default is None.
- Returns:
The sampled elements.
- Return type:
np.ndarray
Examples
>>> import numpy as np
>>> import rsaitehu.sampling as sampling
>>> sampling.sampling_np_array_elements(np.array([1,2,3,4,5]), 3, False, seed=42)
array([2, 5, 3])
>>> sampling.sampling_np_array_elements(np.array([(1,2),(3,4),(5,6),(7,8),(9,10)]), 3, False, seed=42)
array([[ 3,  4],
   [ 9, 10],
   [ 5,  6]])
- sampling.sampling_np_arrays_from_enumerable(source_list: List | ndarray, cardinality_of_np_arrays: int, number_of_np_arrays: int = 1, num_source_elems: int | None = None, seed: int | None = None) List[ndarray][source]
Returns a list with number_of_np_arrays numpy arrays of size cardinality_of_np_arrays with random elements from a list or numpy array.
- Parameters:
source_list (Union[list, np.ndarray]) – The list or numpy array to sample from.
cardinality_of_np_arrays (int) – The cardinality of the numpy arrays to generate.
number_of_np_arrays (int) – The number of numpy arrays to generate. Default is 1.
num_source_elems (int) – The number of elements in the source list or numpy array. Default is None.
seed (int) – The seed value for the random number generator. Default is None.
- Returns:
List of numpy arrays containing the sampled arrays.
- Return type:
List[np.ndarray]
- Example:
>>> import rsaitehu.sampling as sampling
>>> import numpy as np
>>> sampling.sampling_np_arrays_from_enumerable(np.array([1,2,3,4,5,6,7,8,9,10]), 3, 2, seed=42)
>>> [array([9, 2, 6]), array([1, 8, 3])]
>>> np.random.seed(42)
>>> random_3d_points = np.random.rand(100, 3)
>>> random_np_arrays_of_points = sampling.sampling_np_arrays_from_enumerable(random_3d_points, cardinality_of_np_arrays=3, number_of_np_arrays=4, seed=42)
>>> random_np_arrays_of_points
>>> [array([[0.85300946, 0.29444889, 0.38509773],
>>> [0.72821635, 0.36778313, 0.63230583],
>>> [0.54873379, 0.6918952 , 0.65196126]]),
>>> array([[0.32320293, 0.51879062, 0.70301896],
>>> [0.11986537, 0.33761517, 0.9429097 ],
>>> [0.18657006, 0.892559  , 0.53934224]]),
>>> array([[0.14092422, 0.80219698, 0.07455064],
>>> [0.94045858, 0.95392858, 0.91486439],
>>> [0.60754485, 0.17052412, 0.06505159]]),
>>> array([[0.37454012, 0.95071431, 0.73199394],
>>> [0.59789998, 0.92187424, 0.0884925 ],
>>> [0.11959425, 0.71324479, 0.76078505]])]
- sampling.sampling_parallelepiped_3d(n_samples: int, normal1: Tuple[float, float, float], normal2: Tuple[float, float, float], normal3: Tuple[float, float, float], center: Tuple[float, float, float], length1: float, length2: float, length3: float, seed: int | None = None) List[Tuple[float, float, float]][source]
Sample n_samples points from a parallelepiped
The parallelogram is defined by the vectors normal1, normal2 and normal3, the center and the lengths of the sides.
- Parameters:
n_samples (int) – The number of samples to generate.
normal1 (Tuple[float, float, float]) – The first vector normal to the sides of the parallelepiped.
normal2 (Tuple[float, float, float]) – The second vector normal to the sides of the parallelepiped.
normal3 (Tuple[float, float, float]) – The third vector normal to the sides of the parallelepiped.
center (Tuple[float, float, float]) – The center of the parallelepiped.
length1 (float) – The length of the first side of the parallelepiped.
length2 (float) – The length of the second side of the parallelepiped.
length3 (float) – The length of the third side of the parallelepiped.
seed (Optional[int]) – The seed to use for the random number generator.
- Returns:
A list of tuples (x, y, z) representing the coordinates of the sampled points.
- Return type:
List[Tuple[float, float, float]]
Note
The samples are uniformly distributed on the parallelepiped.
Examples
Sample 100 points from a parallelepiped in an arbitrary position and with arbitrary sides:
Required imports:
>>> import rsaitehu.sampling as sampling
>>> import rsaitehu.geometry as geometry
>>> import matplotlib.pyplot as plt
>>> import numpy as np
Define the parameters of the parallelepiped and the number of points to sample:
>>> n_samples = 100
>>> normal1 = (1, 1, 0)
>>> normal2 = (-2, 1, 1)
>>> normal3 = (1, -1, 3)
>>> center = (1, 2, 0)
>>> length1 = 5
>>> length2 = 4
>>> length3 = 3
Sample the points:
>>> samples = sampling.sampling_parallelepiped_3d(n_samples=n_samples, normal1=normal1, normal2=normal2,
...                                              normal3=normal3, center=center, length1=length1,
...                                              length2=length2, length3=length3, seed=42)
>>> # list the first 5 samples
>>> samples[:5]
[array([ 4.82213591,  1.47208906, -3.92469311]),
array([-1.74561756,  1.03184009,  2.53618024]),
array([ 6.03115264,  2.54288771, -2.35494829]),
array([ 0.91594816, -1.49252787, -1.07725051]),
array([ 1.49163196, -2.02162286,  0.14431054])]
Plot the 3D parallelepiped and the samples:
>>> samples = np.array(samples)
>>> fig = plt.figure()
>>> ax = fig.add_subplot(111, projection='3d')
>>> ax.scatter(samples[:, 0], samples[:, 1], samples[:, 2])
>>> # create title from n_samples, center, and radius, using fstring
>>> title = (f'{n_samples} Samples on a 3D Parallelepiped with normal vectors {normal1}, {normal2} and {normal3}, '
>>>         f'center {center}, length1 of {length1}, length2 of {length2} and length3 of {length3}')
>>> ax.set_title(title)
>>> # Draw the parallelepiped
>>> vertices = geometry.get_parallelepiped_3d_vertices(center, normal1, normal2, normal3, length1, length2, length3)
>>> # Define the edges of the 3d parallelepiped
>>> edges = [(0, 1), (1, 2), (2, 3), (3, 0), (4, 5), (5, 6),
>>>         (6, 7), (7, 4), (0, 4), (1, 5), (2, 6), (3, 7)]
>>> # Plot the edges
>>> for edge in edges:
>>>     ax.plot([vertices[edge[0]][0], vertices[edge[1]][0]],
>>>         [vertices[edge[0]][1], vertices[edge[1]][1]],
>>>         [vertices[edge[0]][2], vertices[edge[1]][2]], color='red')
>>> # Draw the normals at a quarter of their corresponding length
>>> quarter_length1 = length1 / 4
>>> quarter_length2 = length2 / 4
>>> arrow_length1 = quarter_length1 / 2
>>> arrow_length2 = quarter_length2 / 2
>>> ax.quiver(center[0], center[1], center[2], normal1[0], normal1[1], normal1[2], length=arrow_length1, normalize=False, color='red')
>>> ax.quiver(center[0], center[1], center[2], normal2[0], normal2[1], normal2[2], length=arrow_length2, normalize=False, color='red')
>>> ax.quiver(center[0], center[1], center[2], normal3[0], normal3[1], normal3[2], length=arrow_length2, normalize=False, color='red')
>>> ax.set_xlabel('X')
>>> ax.set_ylabel('Y')
>>> ax.set_zlabel('Z')
>>> plt.show()

- sampling.sampling_parallelogram_2d(n_samples: int, normal1: Tuple[float, float], normal2: Tuple[float, float], center: Tuple[float, float], length1: float, length2: float, seed: int | None = None) List[Tuple[float, float]][source]
Sample a n_samples number of points from a 2D parallelogram.
The parallelogram has sides parallel to the vectors normal1 and normal2, with lengths length1 and length2 respectively, and centered at center.
- Parameters:
n_samples (int) – The number of samples to generate.
normal1 (Tuple[float, float]) – The first vector normal to the sides of the parallelogram.
normal2 (Tuple[float, float]) – The second vector normal to the sides of the parallelogram.
center (Tuple[float, float]) – The center of the parallelogram.
length1 (float) – The length of the first side of the parallelogram.
length2 (float) – The length of the second side of the parallelogram.
- Returns:
A list of tuples (x, y) representing the coordinates of the sampled points.
- Return type:
List[Tuple[float, float]]
Note
The samples are uniformly distributed on the parallelogram.
Examples
Sample 100 points from a parallelogram in an arbitrary position and with arbitrary sides:
Required imports:
>>> import rsaitehu.sampling as sampling
>>> import rsaitehu.geometry as geometry
>>> import matplotlib.pyplot as plt
>>> import numpy as np
Define the parameters of the parallelogram and the number of points to sample:
>>> n_samples = 100
>>> normal1 = (1, 1)
>>> normal2 = (-2, 1)
>>> center = (1, 2)
>>> length1 = 5
>>> length2 = 4
Sample the points:
>>> samples = sampling.sampling_parallelogram_2d(n_samples=n_samples, normal1=normal1, normal2=normal2,
                                            center=center, length1=length1, length2=length2, seed=42)
>>> # list the first 5 samples
>>> samples[:5]
[(5.497047950508083, 0.7971770131800864),
(2.0894606866550145, -0.23201045555911293),
(0.7687601714367718, 3.8891540205117074),
(6.265387177488898, 2.3086531690418917),
(4.3712313429217895, -0.2712020238213664)]
Plot the samples:
>>> fig, ax = plt.subplots()
>>> ax.scatter(*zip(*samples))
>>> ax.set_aspect('equal')
>>> center = np.array(center)
>>> normal1 = np.array(normal1)
>>> normal2 = np.array(normal2)
>>> vertex1 = center + normal1 * length1 / 2 + normal2 * length2 / 2
>>> vertex2 = center - normal1 * length1 / 2 + normal2 * length2 / 2
>>> vertex3 = center - normal1 * length1 / 2 - normal2 * length2 / 2
>>> vertex4 = center + normal1 * length1 / 2 - normal2 * length2 / 2
>>> xlim_min = min(vertex1[0], vertex2[0], vertex3[0], vertex4[0])
>>> xlim_max = max(vertex1[0], vertex2[0], vertex3[0], vertex4[0])
>>> ylim_min = min(vertex1[1], vertex2[1], vertex3[1], vertex4[1])
>>> ylim_max = max(vertex1[1], vertex2[1], vertex3[1], vertex4[1])
>>> graph_limits = geometry.get_limits_of_graph_from_limits_of_object(xlim_min, xlim_max, ylim_min, ylim_max)
>>> ax.set_xlim(graph_limits[0], graph_limits[1])  # Set x-axis limits
>>> ax.set_ylim(graph_limits[2], graph_limits[3])  # Set y-axis limits
>>> # create title from n_samples, center, and radius, using f-string
>>> title = (f'{n_samples} Samples on a Parallelogram with normal vectors ({normal1[0]}, {normal1[1]}) '
>>>         f'and ({normal2[0]}, {normal2[1]}), center ({center[0]}, {center[1]}), length1 of {length1}, '
>>>         f'and length2 of {length2}'
>>>          )
>>> ax.set_title(title)
>>> # draw also the parallelogram in red
>>> vertices = geometry.get_parallelogram_2d_vertices(center, normal1, normal2, length1, length2)
>>> ax.plot([vertices[0][0], vertices[1][0]], [vertices[0][1], vertices[1][1]], color='r')
>>> ax.plot([vertices[1][0], vertices[2][0]], [vertices[1][1], vertices[2][1]], color='r')
>>> ax.plot([vertices[2][0], vertices[3][0]], [vertices[2][1], vertices[3][1]], color='r')
>>> ax.plot([vertices[3][0], vertices[0][0]], [vertices[3][1], vertices[0][1]], color='r')
>>> # Draw the X and Y axes in dotted lines
>>> ax.axhline(0, linestyle='dotted', color='black')
>>> ax.axvline(0, linestyle='dotted', color='black')
>>> # Draw the normals at a quarter of their corresponding length
>>> quarter_length1 = length1 / 8
>>> quarter_length2 = length2 / 8
>>> arrow_length1 = quarter_length1 / 2
>>> arrow_length2 = quarter_length2 / 2
>>> ax.arrow(center[0], center[1], normal1[0] * quarter_length1, normal1[1] * quarter_length1,
>>>         head_width=arrow_length1, head_length=arrow_length2, fc='b', ec='b')
>>> ax.arrow(center[0], center[1], normal2[0] * quarter_length2, normal2[1] * quarter_length2,
>>>         head_width=arrow_length2, head_length=arrow_length1, fc='b', ec='b')
>>> plt.show()

- sampling.sampling_parallelogram_3d(n_samples: int, normal1: Tuple[float, float, float], normal2: Tuple[float, float, float], center: Tuple[float, float, float], length1: float, length2: float, seed: int | None = None) List[Tuple[float, float, float]][source]
Sample n_samples points from a parallelogram
The parallelogram is defined by the vectors normal1 and normal2, the center and the lengths of the sides.
- Parameters:
n_samples (int) – The number of samples to generate.
normal1 (Tuple[float, float, float]) – The first vector normal to the sides of the parallelepiped.
normal2 (Tuple[float, float, float]) – The second vector normal to the sides of the parallelepiped.
center (Tuple[float, float, float]) – The center of the parallelepiped.
length1 (float) – The length of the first side of the parallelepiped.
length2 (float) – The length of the second side of the parallelepiped.
seed (Optional[int]) – The seed to use for the random number generator.
- Returns:
A list of tuples (x, y, z) representing the coordinates of the sampled points.
- Return type:
List[Tuple[float, float, float]]
Note
The samples are uniformly distributed on the parallelogram.
Examples
Sample 100 points from a parallelogram in an arbitrary position and with arbitrary sides:
Required imports:
>>> import rsaitehu.sampling as sampling
>>> import rsaitehu.geometry as geometry
>>> import matplotlib.pyplot as plt
>>> import numpy as np
Define the parameters of the parallelogram and the number of points to sample:
>>> n_samples = 100
>>> normal1 = (1, 1, 0)
>>> normal2 = (-2, 1, 1)
>>> center = (1, 2, 0)
>>> length1 = 5
>>> length2 = 4
Sample the points:
>>> samples = sampling.sampling_parallelogram_3d(n_samples=n_samples, normal1=normal1, normal2=normal2,
...                                              center=center, length1=length1, length2=length2, seed=42)
>>> # list the first 5 samples
>>> samples[:5]
[array([ 5.49704795,  0.79717701, -1.89995698]),
array([ 2.08946069, -0.23201046, -1.10715705]),
array([0.76876017, 3.88915402, 0.70679795]),
array([ 6.26538718,  2.30865317, -1.65224467]),
array([ 4.37123134, -0.27120202, -1.88081112])]
Plot the 3D parallelogram and the samples:
>>> samples = np.array(samples)
>>> fig = plt.figure()
>>> ax = fig.add_subplot(111, projection='3d')
>>> ax.scatter(samples[:, 0], samples[:, 1], samples[:, 2])
>>> # create title from n_samples, center, and radius, using fstring
>>> title = (f'{n_samples} Samples on a 3D Parallelogram with normal vectors {normal1} and {normal2}, '
>>>         f'center {center}, length1 of {length1} and length2 of {length2}')
>>> ax.set_title(title)
>>> # Draw the parallelogram
>>> vertices = geometry.get_parallelogram_3d_vertices(center, normal1, normal2, length1, length2)
>>> # Define the edges of the 3d parallelogram
>>> edges = [(0, 1), (1, 2), (2, 3), (3, 0)]
>>> # Plot the edges
>>> for edge in edges:
>>>     ax.plot([vertices[edge[0]][0], vertices[edge[1]][0]],
>>>         [vertices[edge[0]][1], vertices[edge[1]][1]],
>>>         [vertices[edge[0]][2], vertices[edge[1]][2]], color='red')
>>> # Draw the normals at a quarter of their corresponding length
>>> quarter_length1 = length1 / 4
>>> quarter_length2 = length2 / 4
>>> arrow_length1 = quarter_length1 / 2
>>> arrow_length2 = quarter_length2 / 2
>>> ax.quiver(center[0], center[1], center[2], normal1[0], normal1[1], normal1[2], length=arrow_length1, normalize=False, color='red')
>>> ax.quiver(center[0], center[1], center[2], normal2[0], normal2[1], normal2[2], length=arrow_length2, normalize=False, color='red')
>>> ax.set_xlabel('X')
>>> ax.set_ylabel('Y')
>>> ax.set_zlabel('Z')
>>> plt.show()

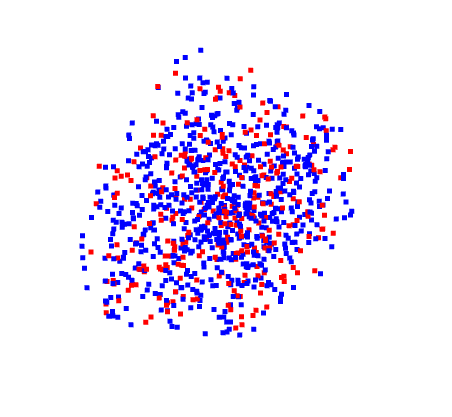
- sampling.sampling_pcd_points(pcd: PointCloud, num_points: int = 1, seed: int | None = None)[source]
Sample points from a point cloud.
- Parameters:
pcd (o3d.geometry.PointCloud) – The point cloud to sample from.
num_points (int) – The number of points to sample. Default is 1.
seed (int) – The seed value for the random number generator. Default is None.
- Returns:
The sampled points.
- Return type:
np.ndarray
Examples
>>> import open3d as o3d
>>> import rsaitehu.sampling as sampling
>>> # Create a point cloud from random points sampled from a 3D parallelogram
>>> n_samples = 1000
>>> normal1 = (1, 1, 0)
>>> normal2 = (-2, 1, 1)
>>> normal3 = (1, -1, 3)
>>> center = (1, 2, 0)
>>> length1 = 5
>>> length2 = 4
>>> length3 = 3
>>> samples = sampling.sampling_parallelogram_3d(n_samples=n_samples, normal1=normal1, normal2=normal2,
                                         normal3=normal3, center=center, length1=length1,
                                         length2=length2, length3=length3, seed=42)
>>> samples[:5]
[array([ 4.82213591,  1.47208906, -3.92469311]),
array([-1.74561756,  1.03184009,  2.53618024]),
array([ 6.03115264,  2.54288771, -2.35494829]),
array([ 0.91594816, -1.49252787, -1.07725051]),
array([ 1.49163196, -2.02162286,  0.14431054])]
>>> pcd = o3d.geometry.PointCloud()
>>> pcd.points = o3d.utility.Vector3dVector(samples)
>>> # paint the point cloud in blue
>>> pcd.paint_uniform_color([0, 0, 1])
>>> # Sample 300 random points from the point cloud
>>> sampled_points = sampling.sampling_pcd_points(pcd, 300, seed=42)
>>> sampled_points[:5]
array([[-3.29369778,  2.38822478,  3.96820711],
        [-0.15203634,  3.14597455,  3.11019749],
        [ 2.41599518, -1.37126689, -3.70481201],
        [ 3.02922805, -2.15456602, -0.98563083],
        [ 0.75636732,  5.3772318 , -2.63251376]])
>>> # create a point cloud from the sampled points
>>> sampled_pcd = o3d.geometry.PointCloud()
>>> sampled_pcd.points = o3d.utility.Vector3dVector(sampled_points)
>>> # paint the sampled points in red
>>> sampled_pcd.paint_uniform_color([1, 0, 0])
>>> # visualize the point clouds
>>> o3d.visualization.draw_geometries([pcd, sampled_pcd])
- sampling.sampling_sphere(n_samples: int = 1, center: Tuple[float, float, float] = (0, 0, 0), radius: float = 1, seed: int | None = None) List[Tuple[float, float, float]][source]
Generate random samples on a sphere with a specified radius and center.
- Parameters:
n_samples (int) – The number of random samples to generate on the circle.
center (Tuple[float, float, float]) – A tuple (x, y, z) representing the center of the circle. Default is (0,0).
radius (float) – The radius of the circle. Default is 1.
seed (Optional[int]) – The seed value for the random number generator. Default is None.
- Returns:
A list of tuples (x, y, z) representing the coordinates of the sampled points.
- Return type:
List[Tuple[float, float, float]]
Note
The samples are uniformly distributed on the sphere.
Examples
Sample 100 points from a sphere:
Required imports:
>>> import rsaitehu.sampling as sampling
>>> import rsaitehu.geometry as geometry
>>> import matplotlib.pyplot as plt
>>> import numpy as np
Define the parameters of the sphere and the number of points to sample:
>>> n_samples = 100
>>> center = (2, 3, 1)
>>> radius = 5
Sample the points:
>>> samples = sampling.sampling_sphere(n_samples=n_samples, center=center, radius=radius, seed=42)
>>> # list the first 5 samples
>>> samples[:5]
[(-0.7678926185117723, 5.364712141640124, 2.766994874229113),
(2.4494148060321668, 0.204406220406967, 1.8926568387590872),
(3.9813939498822686, 1.4025051651799187, -2.4452050018821847),
(5.071282732743802, 5.297317866938179, 1.3622809145470074),
(6.731157639793706, 1.7853437720835348, 1.52040631273227)]
Plot the samples:
>>> samples = np.array(samples)
>>> fig = plt.figure()
>>> ax = fig.add_subplot(111, projection='3d')
>>> ax.scatter(samples[:, 0], samples[:, 1], samples[:, 2])
>>> # plot the sphere
>>> u, v = np.mgrid[0:2*np.pi:20j, 0:np.pi:10j]
>>> x = radius*np.cos(u)*np.sin(v) + center[0]
>>> y = radius*np.sin(u)*np.sin(v) + center[1]
>>> z = radius*np.cos(v) + center[2]
>>> ax.plot_wireframe(x, y, z, color="r")
>>> title = f'{n_samples} Samples on a Sphere with Center ({center[0]}, {center[1]}, {center[2]}) and Radius {radius}'
>>> ax.set_title(title)
>>> ax.set_xlabel('X')
>>> ax.set_ylabel('Y')
>>> ax.set_zlabel('Z')
>>> plt.show()
